
Keep it boring. Boring is good.
Use this like a checklist: start with scope (what changed, where, when), then walk down the section that matches your symptom.
Step 0: Set the scope in 60 seconds (so you don’t chase ghosts)
If you skip this, you’ll “fix” the wrong thing.
- What metric: users, sessions, conversions, revenue, event count, funnel step rate
- Where: iOS only vs all platforms, one app version vs all, one traffic source vs all
- When: exact start time (after an app release? after a campaign? after a config change?)
- How big: percentage change and absolute change
- What’s the comparator: same weekday last week vs last 28 days vs same period last month
If you can’t say “iOS, version 3.4.1, started at ~10am UTC, paid search only,” then do that first.
If installs or “new users” drop: attribution vs tracking vs reporting delay

If the drop is mostly in paid channels, then treat it as attribution-first.
- Then check: campaign spend/delivery in Google Ads (are clicks/impressions normal?)
- Then check: attribution window changes, conversion settings, or campaign tracking parameters (UTMs / gclid handling)
- Then check: whether you’re looking at modeled vs observed conversions (reporting may shift over 24–72 hours)
If the drop is all sources (paid + organic + direct) and starts right after an app release, then suspect a measurement break (SDK init, consent gating, or event dispatch).
Example: “New users down 35% on iOS only, starting exactly when v5.2 shipped.” That’s usually not user behavior; it’s usually instrumentation or config.
If conversions drop but traffic is steady: define “conversion” and check the funnel edges
Conversions can “drop” because the event stopped firing, because the user can’t reach the moment, or because the definition changed.
If sessions/users are flat but conversions fall, then do this in order:
- Then verify the event definition: same event name? same parameters? same “count once” vs “count many” setting?
- Then check the trigger screen: did UI flow change so users no longer reach the conversion step?
- Then check version split: is the drop concentrated in the newest iOS version?
- Then check edge conditions: login required, permissions prompts, paywall availability, network errors
Example: “Purchase event down 20%, but only on iOS 17.5 devices.” That points to an OS-specific flow/permission/payment issue more than a campaign issue.
If event counts spike: duplication, retries, or a loop
If event count spikes but users don’t, then assume duplication until proven otherwise.
- Then check: is the event firing on view-load AND on button tap after a refactor?
- Then check: offline queue/retry behavior (are failed sends being retried without de-duplication?)
- Then check: background/foreground transitions (iOS lifecycle changes can double-trigger)
- Then check: server-side + client-side both sending the “same” conversion
If the spike happens right after adding a new parameter or new logging wrapper, then look for “log on every render” mistakes.
Example: A “screen_view” event fires every time a SwiftUI view re-renders. Users stay flat, events jump 4×.
If a funnel step tanks: it’s usually a boundary problem (definition, navigation, or timing)
Funnels are brittle because each step is a contract: “this exact event means this exact user action.”
If step 2 drops but step 1 is normal, then ask:
- Definition: did step 2 rename? did the parameter filter change?
- Navigation: did the path change (new modal, new tab, new deep link behavior)?
- Timing: did step 2 move later (after a network call), increasing drop-off?
- Eligibility: is step 2 now behind login/consent/permission?
If the funnel is filtered by “iOS app version” and only one version is affected, then treat it like a release regression until you rule out reporting.
If numbers disagree between Google tools: map what each one is counting
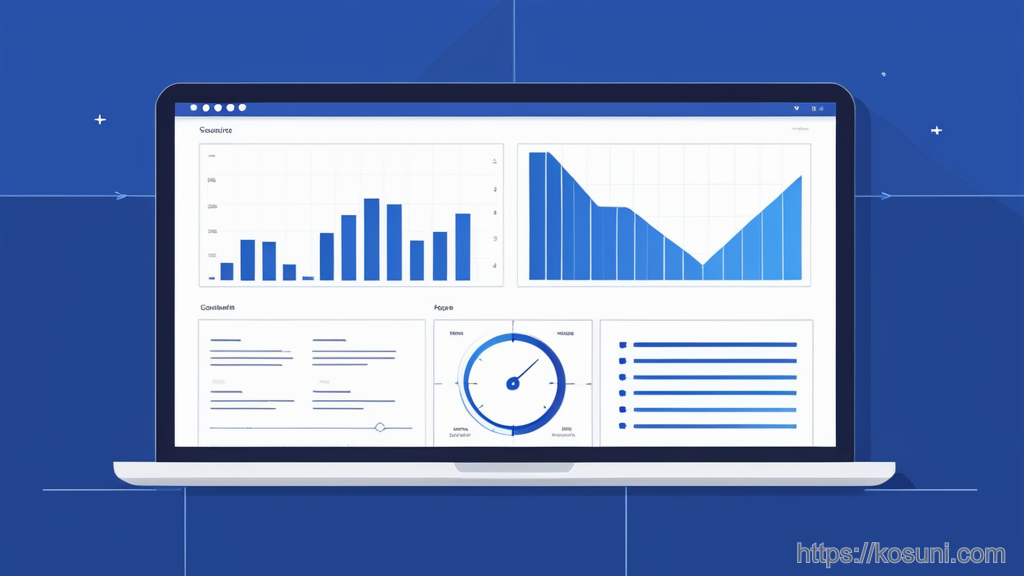
If Google Ads shows conversions but your analytics view doesn’t, then check whether you’re comparing:
- Click-based vs event-based: Ads may attribute conversions differently than your in-app events
- Time zone: account time zone vs property time zone
- Attribution model/window: last-click vs data-driven, 7-day vs 30-day, etc.
- Modeled vs observed: iOS privacy constraints can shift what’s directly observed
If the disagreement started after linking/unlinking accounts or changing conversion settings, then document the exact change and re-check with a 3–7 day window (some reports settle).
Fast “what should I do next?” decision lines (copy/paste)
- If the change is iOS-only and starts right after an app release, then audit SDK init/consent/event firing on that version first.
- If traffic is stable but conversion event drops, then validate the conversion event definition and whether users can still reach the trigger screen.
- If users are stable but events spike, then hunt duplication (render loops, retries, lifecycle double-fires).
- If paid installs drop but spend is steady, then investigate attribution/reporting/measurement configuration before product changes.
- If tools disagree, then list definitions (time zone, attribution window, model) before assuming tracking is broken.
Takeaway: treat “weird analytics” as a sorting problem
On iOS, most “bad numbers” become manageable once you sort them into: (1) release/instrumentation, (2) attribution/privacy/reporting, or (3) real behavior change. Use the if/then path to pick one bucket, run one tight check, and only then widen the investigation.